In our previous discussion, we compared the health impacts of artificial sweeteners, natural sweeteners, and regular sugar. But if you want to know exactly what kind of sweetener or other hidden compounds are lurking in your food, there is one non-negotiable skill you must master: reading the ingredients list.
Most of the time, we are guilty of only looking at the front of the packaging. After all, that’s where the fonts are largest, the pictures are prettiest, and manufacturers plaster their core selling points.
While this sounds convenient on paper, the front label is actually a minefield of marketing traps.
Setting aside outright counterfeit brands, news outlets frequently expose businesses that cleverly disguise their trademarks to mislead consumers—using buzzwords like “hand-crafted,” “more than half a bag,” or “nothing else added.”
A slightly more subtle tactic involves clever wordplay and packaging games. Take “lobster-flavored shrimp paste,” for example; it easily tricks people into thinking it contains actual lobster. Meanwhile, terms like “sugar-free,” “flavored,” and “high protein” exploit the general public’s loose understanding of nutritional science.
Let this sink in: “sugar-free” does not automatically mean a product is healthy, and anything labeled as “XX-flavored” is a confession that it isn’t actually made from XX!
So, how do you avoid falling into these traps? Without a doubt, learning to audit the nutrition facts label and the ingredients list is your best line of defense.
P.S. When it comes to malicious counterfeit brands, even a deep audit of the nutrition label might not save you. In those cases, your only option is to keep your eyes peeled and buy from reputable sources.
How to Decode a Nutrition Facts Label
Please look at the image below. This is an example of a frozen lasagna nutrition label taken directly from the official FDA website (which provides an incredibly thorough breakdown of labeling standards):
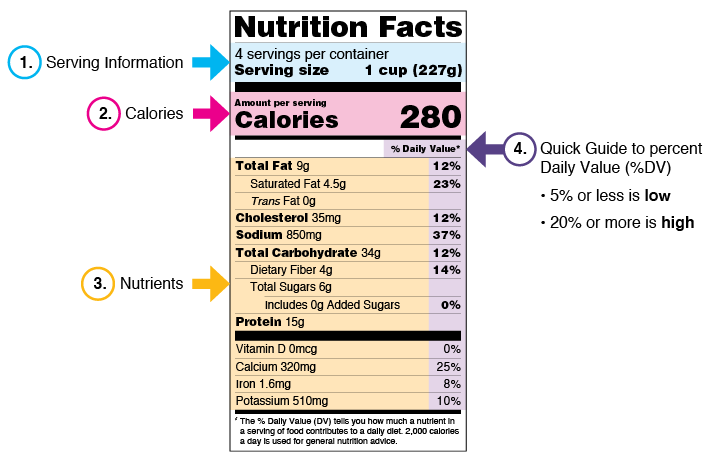
A standard nutrition label is broken down into four foundational quadrants: Serving Size, Calories, Nutrient Amounts, and Percent Daily Value (%DV).
1. Serving Size
This indicates the number of servings contained within the entire package, followed by the specific weight of a single serving. As shown in the diagram, this particular package contains 4 servings, with each serving weighing 227 grams.
Keep in mind that not all foods will present the information this way. If you buy a massive tub of rolled oats, the packaging will likely only state the total net weight.
The absolute most critical rule of serving sizes is that you must analyze this number in tandem with the calories and nutrient metrics below.
2. Calories
When it comes to calories and nutrients, manufacturers typically use one of two reporting methods: “per 100g” or “per serving.”
Misunderstanding this distinction is the number one reason people drastically underestimate their caloric intake. For instance, if the label states the calories per serving, but you mistakenly assume it is per 100g, you will vastly miscalculate the math. You’ll end up mindlessly overeating, causing your daily caloric intake to absolutely skyrocket.
The concept of a calorie itself is straightforward: it represents how much energy (in kilocalories) is provided by that specific serving or per 100g. Note that “calories” and “kilocalories” (kcal) are used interchangeably in a nutritional context. In the label above, each individual serving contains 280 calories. Therefore, eating the entire 4-serving package means you are consuming a grand total of 1,120 calories.
Furthermore, depending on where the product is manufactured, energy might be expressed in Kilojoules (kJ) instead of calories. In these scenarios, you need to do a quick conversion:
1kcal ≈4.18kj
To keep the math simple on the fly, you can just divide the kilojoule number by 4 to estimate the total calories.
Regardless of your macronutrient ratios—whether you are running a high-carb, low-fat, or high-protein protocol—maintaining a caloric balance is the absolute cornerstone of weight management. If your total energy intake exceeds your total daily energy expenditure (TDEE), weight loss becomes a mathematical impossibility. Anchor this truth in your mind.
3. Nutrients
This section covers your primary macronutrients: fats, proteins, and carbohydrates, along with critical subcategories like saturated fat, trans fat, cholesterol, and total sugars.
When it comes to micronutrients, you will usually only see Sodium listed as a default. This isn’t because other minerals aren’t important; it is simply because the law mandates its inclusion.
Of course, for fortified foods—such as products boasting “high calcium” or “high iron”—or foods that naturally contain a high concentration of specific minerals (like magnesium in oats or calcium in milk), manufacturers will proudly display them.
However, anomalies do happen where a nutrient is present in the food but completely absent from the label. A textbook example of this is coconut water. Pure coconut water naturally overflows with potassium, yet you will find several brands that don’t list potassium anywhere on their label.
This does not mean the product is devoid of potassium (unless it is a complete counterfeit). Rather, it means the manufacturer simply chose not to pay for that specific component to be laboratory tested.
Think of it like a medical check-up: if you want to test for specific trace minerals or hormones in your blood, you have to pay an extra fee to add those line items to your panel. For food manufacturers, testing only what the law strictly requires is the most economically sound route.
For every nutrient listed, you will see two pieces of data: the absolute weight and the Percent Daily Value (%DV).
The absolute weight is straightforward. As illustrated in the lasagna diagram above, one serving provides 9g of fat, 34g of carbs, 15g of protein, and 850mg of sodium.
Ingredients like trans fats and cholesterol are a clear case of “the less, the better.” As for the other nutrients, if you aren’t sure how to determine your ideal daily intake or don’t want to obsess over tedious math, I highly recommend reading our comprehensive [how to plan weekly meals guide] to map out your personalized caloric and macronutrient targets.
A highly practical way to judge these nutrient amounts at a glance is to look at the Percent Daily Value (%DV) or, depending on your region, the Nutrient Reference Value (%NRV).
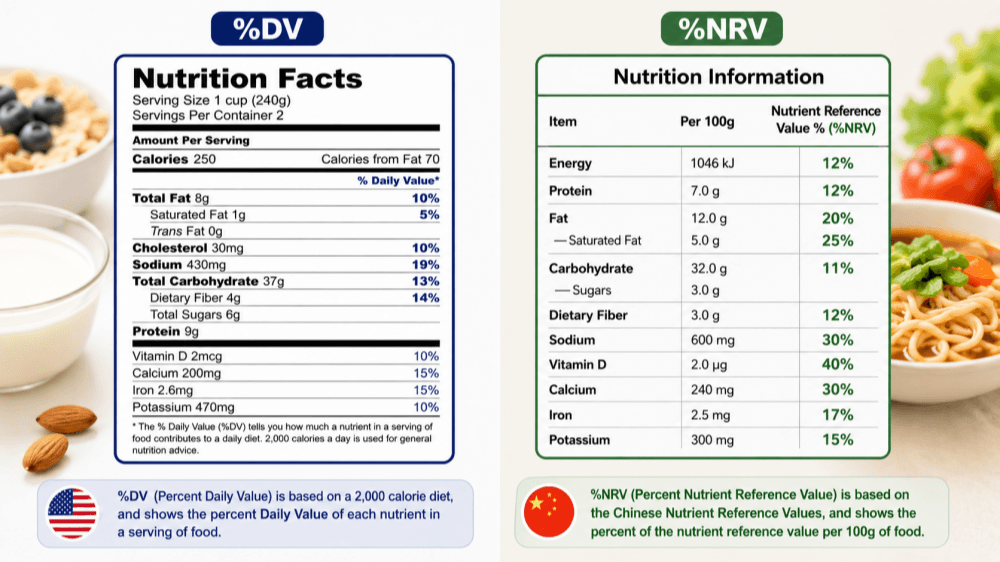
While the nomenclature varies slightly by country, the core concept remains identical. You can simply think of it as: “You have already ticked off X% of your required daily intake for this specific nutrient.”
Using our frozen lasagna example from earlier, one serving delivers 34g of carbohydrates, which is listed as 12% DV. Mathematically speaking, this means if you were to eat roughly 10 servings of this lasagna, you would hit exactly 100% of your daily carbohydrate allocation.
Now, here is where we need to address the catch. While the %DV is an excellent baseline reference, relying on it blindly can backfire.
The standard parameters set by regulatory bodies like the FDA are calibrated against a generic 2,000-calorie daily diet. This baseline roughly reflects the energy needs of a sedentary adult male or a moderately active adult female.
If your primary goal is fat loss, this standard metric quickly loses its utility. The foundational protocol for weight loss involves calculating your individual Total Daily Energy Expenditure (TDEE) and subtracting roughly 500 calories to establish a sustainable caloric deficit. Once you alter that baseline, the default %DV on a box becomes irrelevant.
Furthermore, specific dietary protocols will render these standard daily value percentages completely obsolete. If you are experimenting with a ketogenic or a high-protein protocol, your ideal macro ratios for protein, carbs, and fats will diverge drastically from the standard government baseline.
It is also worth noting that these benchmarks vary from country to country. For instance, mainland China sets a significantly lower daily upper limit for fat intake compared to the United States or Europe—a cross-border discrepancy that becomes even more glaring when you look at micronutrient thresholds.
The Micronutrient Anomaly: Why Do Some Values Exceed 100%?
Speaking of micronutrients, you might wonder why certain fortified foods or dedicated dietary supplements display %DV numbers that soar past 100%, sometimes reaching into the thousands.
To understand this, we must first establish a fundamental distinction: macro and micro percentages do not mean the same thing on a label. Macronutrients are tethered to a strict caloric balance, meaning their combined percentages cannot mathematically overshoot a 100% ceiling.
Micronutrient daily values, on the other hand, are established as a “baseline safety net” designed primarily to prevent overt nutritional deficiencies.
Take Vitamin C, for example. The FDA-established Daily Value is set at a modest 90mg. This isn’t the optimal dose for peak performance; it is merely the minimum threshold required to keep you from developing scurvy. You can safely consume 500% or even 1000% of this DV to reap enhanced antioxidant benefits, provided you stay under the Tolerable Upper Intake Level (UL) of 2,000mg.
Secondly, the human body exhibits a notoriously low absorption rate for synthesized micronutrients added to fortified foods. To counteract this poor bioavailability, manufacturers intentionally megadose the formulation to ensure that the amount your body actually absorbs meets the baseline standard.
For a deep dive into why these absorption roadblocks occur and how to intelligently structure your micronutrient intake, I highly recommend checking out our comprehensive guide: [Best Vitamins For Energy Athletic Performance].
P.S. The Sole Exception to the Rule: Sodium is a completely different beast. Its DV and UL are tightly bound at the exact same ceiling of 2,300mg. Given the oil-heavy and salt-laden nature of the modern diet, your sodium intake is one metric you should restrict with absolute clinical precision.
How to Audit an Ingredients List
Now that you are equipped to navigate nutrition facts, we must address a frustrating reality: some of the biggest marketing traps are completely invisible on the nutrition grid. To catch them, you have to flip the package over and scrutinize the Ingredients List.
The ingredients list tells the unvarnished story of what a food product is actually made of. What many consumers fail to realize is that ingredients are legally required to be listed in descending order of predominance by weight.
In other words, the very first ingredient listed constitutes the highest percentage of the product, while the final ingredient shares the smallest footprint.
Granted, regulations don’t force companies to disclose exact percentages. A commercial beverage could theoretically consist of 99% water and 1% of everything else combined, and the raw layout of the list won’t explicitly show you that mathematical split.
So, what should you look for? Focus intently on the ingredients that align with your health goals.
For instance, a package of “five-grain multigrain noodles” might command a hefty price premium over standard white flour noodles. But if a quick audit of the ingredients list reveals that the five-grain blend is buried at the very bottom of the list, the nutritional value it brings to the table is virtually negligible compared to its markup.
The same trap applies to yogurt. Yogurt naturally carries a “health halo,” leading countless consumers to reach for it as a guilt-free beverage. The harsh reality is that water and granulated sugar frequently sit higher on the ingredient hierarchy than actual raw milk. In those cases, you aren’t drinking a health food; you are drinking a yogurt-flavored sugar syrup.
Tracking Down the “Hidden Sugars”
Currently, apart from the FDA, which mandates that the exact amount of “Added Sugars” be explicitly stated on the nutrition facts panel, most regulatory bodies around the world have no such requirement.
Consequently, you are left completely in the dark, unable to distinguish whether the listed sugar footprint stems naturally from the food itself (like the fructose in fruit or the lactose in milk) or if it was dumped in as an external added sugar.
This is precisely when you need to pair the nutrition panel with the ingredients list to crack the code.
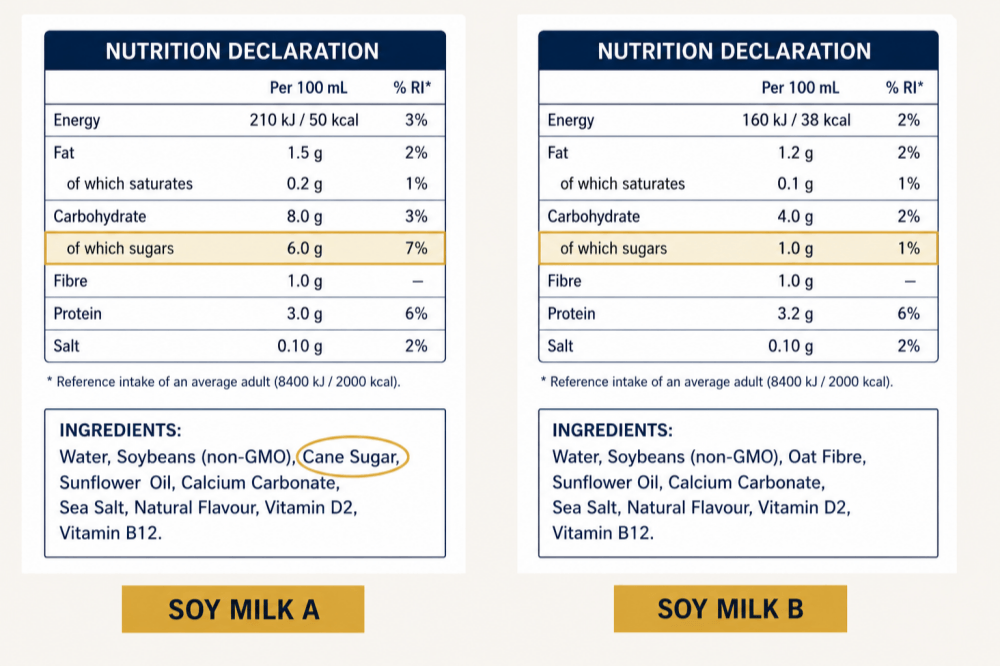
If the nutrition facts panel reveals a massive sugar footprint that closely mirrors the total carbohydrate count, and the ingredients list features sugar, sucrose, or syrup in the top three positions, you can confidently conclude that the product’s carbohydrate profile is almost entirely fueled by added sugars.
What About Alternative Sweeteners?
Because alternative sweeteners deliver negligible calories and require only minute amounts to achieve desired sweetness, they are rarely afforded their own line item on a nutrition facts panel. Bulky sweeteners like sugar alcohols are typically swept directly into the total carbohydrate tally. Therefore, if you are particular about the specific types of sweeteners you consume, the ingredients list is your only roadmap.
As we established in our previous article, from a clinical health standpoint, there is no strict hierarchy or “superior tier” among popular sweeteners. More importantly, the mountain of data proving the devastating metabolic harms of high-sugar diets is infinitely stronger and more definitive than any hypothetical risk attributed to sweeteners.
The Ultimate Glucose Assassin: Maltodextrin
Finally, we must expose a notorious ingredient that frequently sneaks into “sugar-free” products while packing a devastating glycemic punch: Maltodextrin.
Maltodextrin is the ultimate stealth operator in corporate food science. Because it is chemically classified as a complex carbohydrate rather than a simple sugar, products loaded with it can legally plaster “Sugar-Free” across their front packaging. On the nutrition facts panel, it hides seamlessly inside the total carbohydrate count while leaving the sugar line item at a pristine 0g.
But don’t let the paperwork fool you. Maltodextrin carries the exact same caloric density as white sugar (4 kcal/g) and boasts a staggering Glycemic Index (GI) of roughly 110—making it significantly more disruptive to blood glucose than table sugar itself. It is a certified caloric and metabolic assassin.
If you are managing diabetes, executing a ketogenic diet, or strictly chasing fat loss, the sight of maltodextrin on a label should prompt an immediate U-turn. If a “sugar-free” product shows a high carbohydrate count on the panel and lists maltodextrin near the top of the ingredients, you can rest assured that those carbs are almost entirely a delivery vehicle for maltodextrin.
Closing Thoughts
Armed with these auditing strategies, you now possess complete sovereignty over what goes into your body, allowing you to manage your dietary structure with total clarity.
To bring this guide to a close, I want to echo a profound truth I once heard during a clinical nutrition lecture:
“A genuinely healthy food—like a crown of fresh broccoli—never needs to wave a flashy label or brag about ‘added dietary fiber’ to prove its worth to your body.”
Learning to decipher food labels is an invaluable skill for navigating the modern supermarket. However, the most bulletproof nutritional strategy will always be a beautifully simple one: minimize the boxes you have to decode, step away from the corporate packages, and prioritize whole fruits and vegetables.
